The Datadog Agent collects many metrics from Consul nodes, including those for:
- Total Consul peers
- Service health - for a given service, how many of its nodes are up, passing, warning, critical?
- Node health - for a given node, how many of its services are up, passing, warning, critical?
- Network coordinates - inter- and intra-datacenter latencies
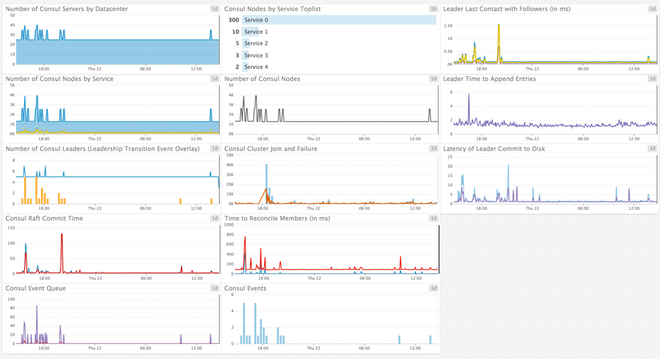
The Consul Agent can provide further metrics with DogStatsD. These metrics are more related to the internal health of Consul itself, not to services which depend on Consul. There are metrics for:
- Serf events and member flaps
- The Raft protocol
- DNS performance
And many more.
Finally, in addition to metrics, the Datadog Agent also sends a service check for each of Consul's health checks, and an event after each new leader election.
The Datadog Agent's Consul check is included in the Datadog Agent package, so you don't need to install anything else on your Consul nodes.
To configure this check for an Agent running on a host:
-
Edit the
consul.d/conf.yamlfile, in theconf.d/folder at the root of your Agent's configuration directory to start collecting your Consul metrics. See the sample consul.d/conf.yaml for all available configuration options.init_config: instances: ## @param url - string - required ## Where your Consul HTTP server lives, ## point the URL at the leader to get metrics about your Consul cluster. ## Use HTTPS instead of HTTP if your Consul setup is configured to do so. # - url: http://localhost:8500
Optionally, you can enable the use_prometheus_endpoint configuration option to get an additional set of metrics from the Consul Prometheus endpoint.
Note: Use the DogStatsD or Prometheus method, do not enable both for the same instance.
-
Configure Consul to expose metrics to the Prometheus endpoint. Set the
prometheus_retention_timenested under the top-leveltelemetrykey of the main Consul configuration file:{ ... "telemetry": { "prometheus_retention_time": "360h" }, ... } -
Edit the
consul.d/conf.yamlfile, in theconf.d/folder at the root of your Agent's configuration directory to start using the Prometheus endpoint.instances: - url: <EXAMPLE> use_prometheus_endpoint: true
Instead of using the Prometheus endpoint, you can configure Consul to send the same set of additional metrics to the Agent through DogStatsD.
-
Configure Consul to send DogStatsD metrics by adding the
dogstatsd_addrnested under the top-leveltelemetrykey in the main Consul configuration file:{ ... "telemetry": { "dogstatsd_addr": "127.0.0.1:8125" }, ... } -
Update the Datadog Agent main configuration file
datadog.yamlby adding the following configs to ensure metrics are tagged correctly:# dogstatsd_mapper_cache_size: 1000 # default to 1000 dogstatsd_mapper_profiles: - name: consul prefix: "consul." mappings: - match: 'consul\.http\.([a-zA-Z]+)\.(.*)' match_type: "regex" name: "consul.http.request" tags: method: "$1" path: "$2" - match: 'consul\.raft\.replication\.appendEntries\.logs\.([0-9a-f-]+)' match_type: "regex" name: "consul.raft.replication.appendEntries.logs" tags: peer_id: "$1" - match: 'consul\.raft\.replication\.appendEntries\.rpc\.([0-9a-f-]+)' match_type: "regex" name: "consul.raft.replication.appendEntries.rpc" tags: peer_id: "$1" - match: 'consul\.raft\.replication\.heartbeat\.([0-9a-f-]+)' match_type: "regex" name: "consul.raft.replication.heartbeat" tags: peer_id: "$1"
Available for Agent versions >6.0
-
Collecting logs is disabled by default in the Datadog Agent, enable it in
datadog.yamlwith:logs_enabled: true
-
Edit this configuration block in your
consul.yamlfile to collect Consul logs:logs: - type: file path: /var/log/consul_server.log source: consul service: myservice
Change the
pathandserviceparameter values and configure them for your environment. See the sample consul.d/conf.yaml for all available configuration options.
For containerized environments, see the Autodiscovery Integration Templates for guidance on applying the parameters below.
| Parameter | Value |
|---|---|
<INTEGRATION_NAME> |
consul |
<INIT_CONFIG> |
blank or {} |
<INSTANCE_CONFIG> |
{"url": "https://%%host%%:8500"} |
Available for Agent versions >6.0
Collecting logs is disabled by default in the Datadog Agent. To enable it, see Kubernetes Log Collection.
| Parameter | Value |
|---|---|
<LOG_CONFIG> |
{"source": "consul", "service": "<SERVICE_NAME>"} |
Run the Agent's status subcommand and look for consul under the Checks section.
Note: If your Consul nodes have debug logging enabled, the Datadog Agent's regular polling shows in the Consul log:
2017/03/27 21:38:12 [DEBUG] http: Request GET /v1/status/leader (59.344us) from=127.0.0.1:53768
2017/03/27 21:38:12 [DEBUG] http: Request GET /v1/status/peers (62.678us) from=127.0.0.1:53770
2017/03/27 21:38:12 [DEBUG] http: Request GET /v1/health/state/any (106.725us) from=127.0.0.1:53772
2017/03/27 21:38:12 [DEBUG] http: Request GET /v1/catalog/services (79.657us) from=127.0.0.1:53774
2017/03/27 21:38:12 [DEBUG] http: Request GET /v1/health/service/consul (153.917us) from=127.0.0.1:53776
2017/03/27 21:38:12 [DEBUG] http: Request GET /v1/coordinate/datacenters (71.778us) from=127.0.0.1:53778
2017/03/27 21:38:12 [DEBUG] http: Request GET /v1/coordinate/nodes (84.95us) from=127.0.0.1:53780
Use netstat to verify that Consul is sending its metrics, too:
$ sudo netstat -nup | grep "127.0.0.1:8125.*ESTABLISHED"
udp 0 0 127.0.0.1:53874 127.0.0.1:8125 ESTABLISHED 23176/consulSee metadata.csv for a list of metrics provided by this integration.
See Consul's Telemetry doc for a description of metrics the Consul Agent sends to DogStatsD.
See Consul's Network Coordinates doc for details on how the network latency metrics are calculated.
consul.new_leader:
The Datadog Agent emits an event when the Consul cluster elects a new leader, tagging it with prev_consul_leader, curr_consul_leader, and consul_datacenter.
See service_checks.json for a list of service checks provided by this integration.
Need help? Contact Datadog support.
Additional helpful documentation, links, and articles: