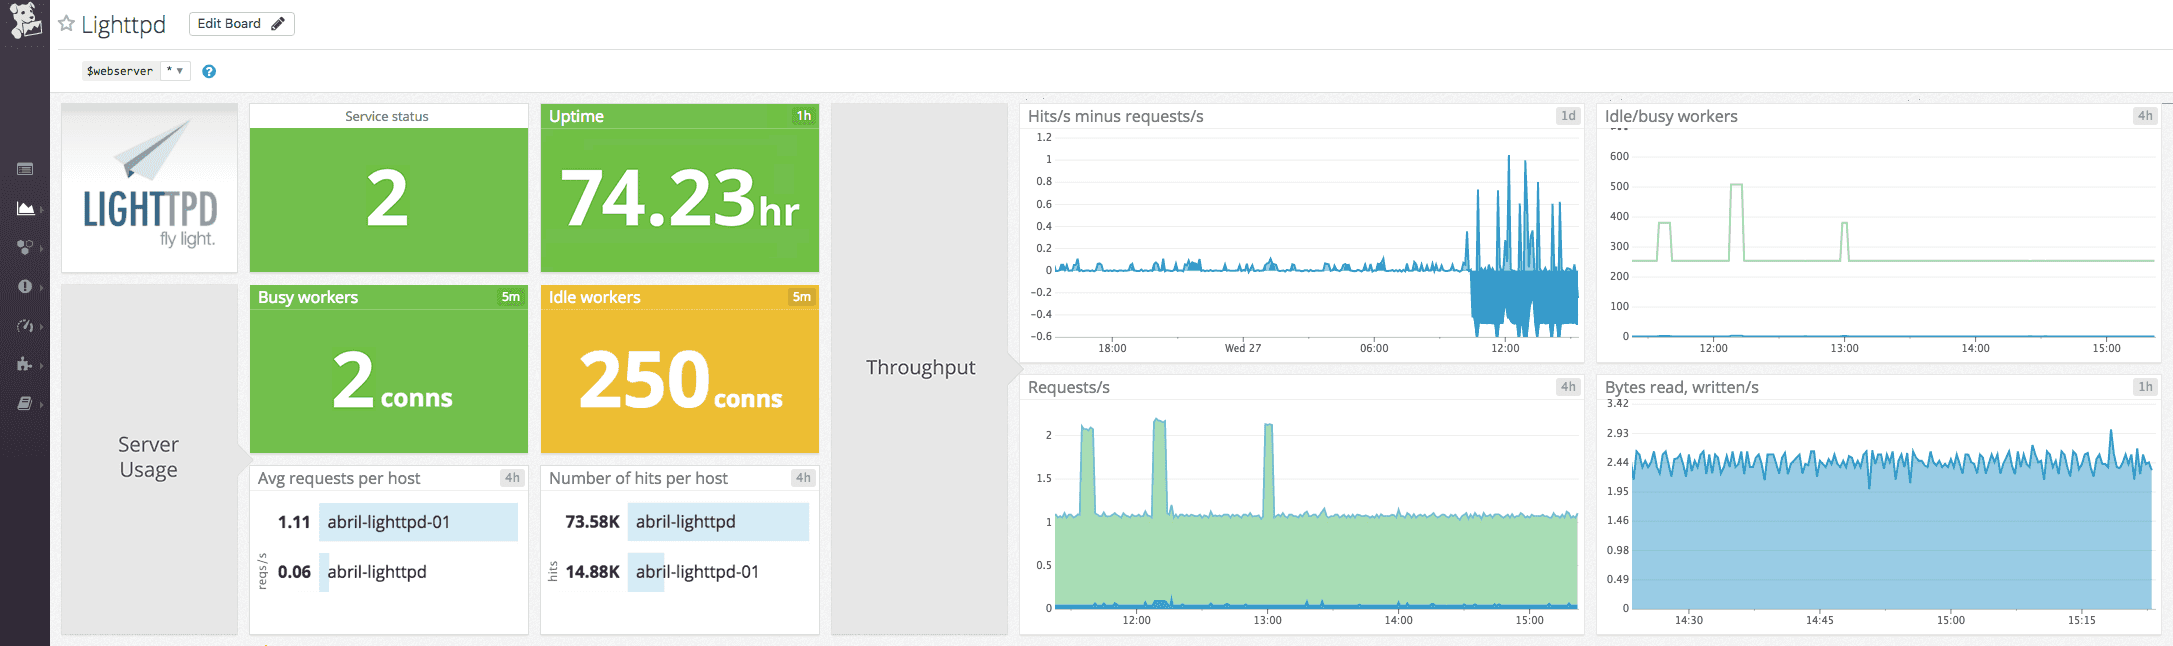
The Agent's lighttpd check tracks uptime, bytes served, requests per second, response codes, and more.
The Lighttpd check is included in the Datadog Agent package, so you don't need to install anything else on your Lighttpd servers.
In addition, install mod_status on your Lighttpd servers.
Follow the instructions below to configure this check for an Agent running on a host. For containerized environments, see the Containerized section.
-
Edit the
lighttpd.d/conf.yamlfile, in theconf.d/folder at the root of your Agent's configuration directory. See the sample lighttpd.d/conf.yaml for all available configuration options:init_config: instances: ## @param lighttpd_status_url - string - required ## Status url of your Lighttpd server. # - lighttpd_status_url: http://localhost/server-status?auto
For containerized environments, see the Autodiscovery Integration Templates for guidance on applying the parameters below.
| Parameter | Value |
|---|---|
<INTEGRATION_NAME> |
lighttpd |
<INIT_CONFIG> |
blank or {} |
<INSTANCE_CONFIG> |
{"lighttpd_status_url": "http://%%host%%/server-status?auto"} |
Run the Agent's status subcommand and look for lighttpd under the Checks section.
See metadata.csv for a list of metrics provided by this integration.
The Lighttpd check does not include any events.
- lighttpd.can_connect:
Returns CRITICAL if the Agent cannot connect to lighttpd to collect metrics, otherwise OK.
Need help? Contact Datadog support.
To get a better idea of how (or why) to monitor Lighttpd web server metrics with Datadog, check out our series of blog posts about it.