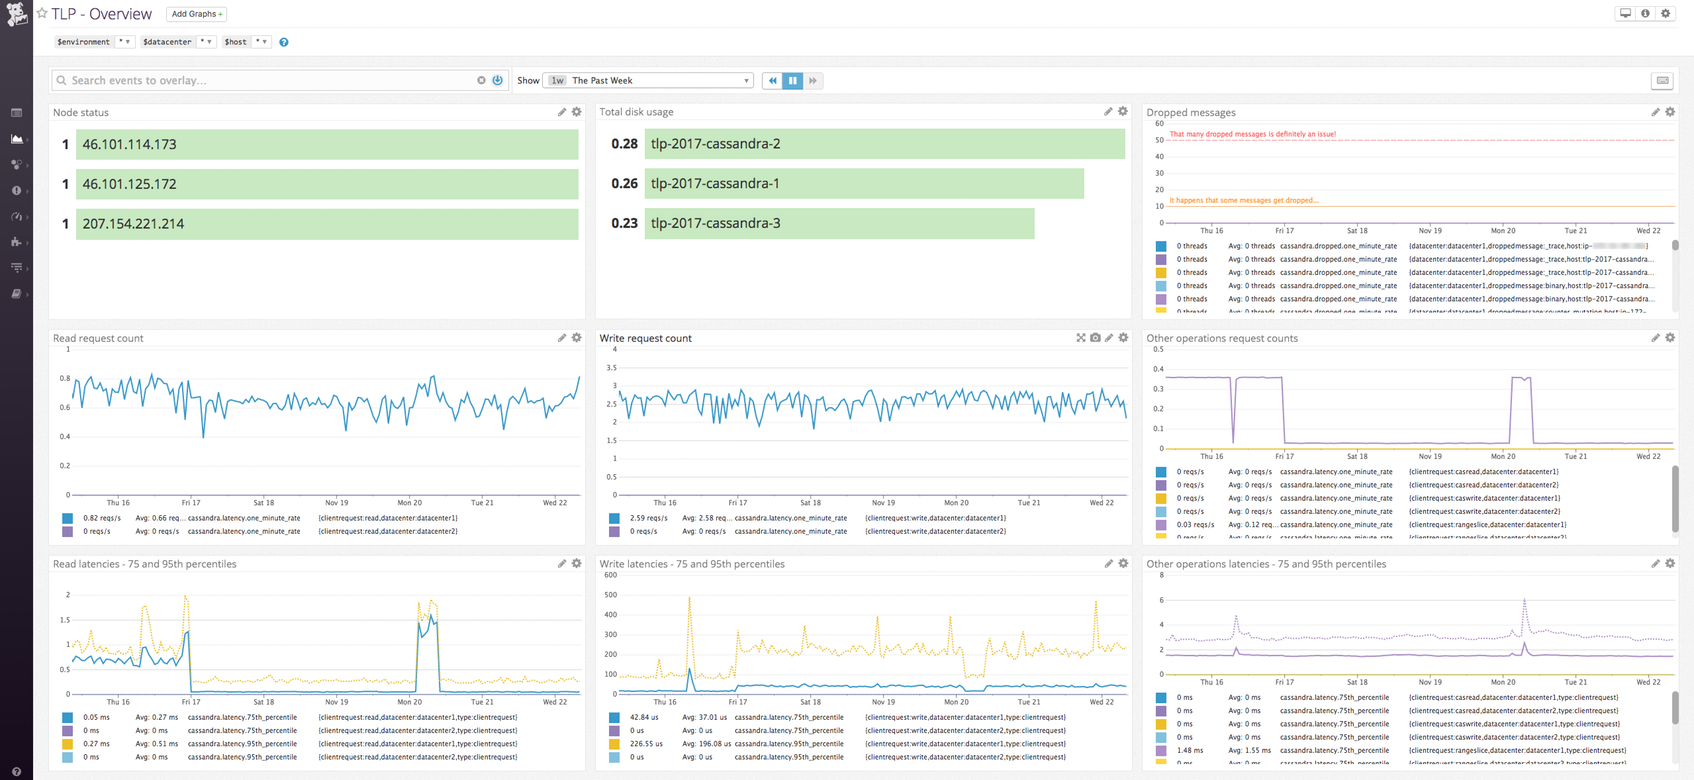
Get metrics from Cassandra in real time to:
- Visualize and monitor Cassandra states.
- Be notified about Cassandra failovers and events.
The Cassandra check is included in the Datadog Agent package, so you don't need to install anything else on your Cassandra nodes. It's recommended to use Oracle's JDK for this integration.
Note: This check has a limit of 350 metrics per instance. The number of returned metrics is indicated in the info page. You can specify the metrics you are interested in by editing the configuration below. To learn how to customize the metrics to collect visit the JMX Checks documentation for more detailed instructions. If you need to monitor more metrics, contact Datadog support.
Follow the instructions below to configure this check for an Agent running on a host. For containerized environments, see the Containerized section.
-
The default configuration of your
cassandra.d/conf.yamlfile activate the collection of your Cassandra metrics. See the sample cassandra.d/conf.yaml for all available configuration options.
Available for Agent versions >6.0
-
Collecting logs is disabled by default in the Datadog Agent, enable it in your
datadog.yamlfile:logs_enabled: true
-
Add this configuration block to your
cassandra.d/conf.yamlfile to start collecting your Cassandra logs:logs: - type: file path: /var/log/cassandra/*.log source: cassandra service: myapplication log_processing_rules: - type: multi_line name: log_start_with_date # pattern to match: DEBUG [ScheduledTasks:1] 2019-12-30 pattern: '[A-Z]+ +\[[^\]]+\] +\d{4}-\d{2}-\d{2}'
Change the
pathandserviceparameter values and configure them for your environment. See the sample cassandra.d/conf.yaml for all available configuration options.To make sure that stacktraces are properly aggregated as one single log, a multiline processing rule can be added.
For containerized environments, see the Autodiscovery Integration Templates for guidance on applying the parameters below.
For containerized environments, see the Autodiscovery with JMX guide.
Available for Agent versions >6.0
Collecting logs is disabled by default in the Datadog Agent. To enable it, see Kubernetes log collection documentation.
| Parameter | Value |
|---|---|
<LOG_CONFIG> |
{"source": "cassandra", "service": "<SERVICE_NAME>"} |
Run the Agent's status subcommand and look for cassandra under the Checks section.
See metadata.csv for a list of metrics provided by this integration.
The Cassandra check does not include any events.
cassandra.can_connect:
Returns CRITICAL if the Agent is unable to connect to and collect metrics from the monitored Cassandra instance, otherwise returns OK.
Need help? Contact Datadog support.